
A: Recent estimates suggest around 58% of the population in the US and over 70% in England have been previously infected, with BIG increases during the Omicron wave.
The CDC recently released an MMWR report estimating the percentage of Americans who have been previously infected with COVID-19. The estimates came from the CDC’s National Commercial Laboratory Seroprevalence Study, which tests blood samples that are submitted for clinical testing. The blood is tested for anti-nucleocapsid (anti-N) antibodies, which are produced in response to SARS-CoV-2 infection but not in response to COVID-19 vaccines which target only the spike protein.
🔑 Key findings:
➡️ Roughly 58% of Americans showed evidence of previous SARS-CoV-2 infection in their blood by February 2022.
➡️ During the Omicron wave from December 2021-February 2022, this estimate increased from 33% to 58%.
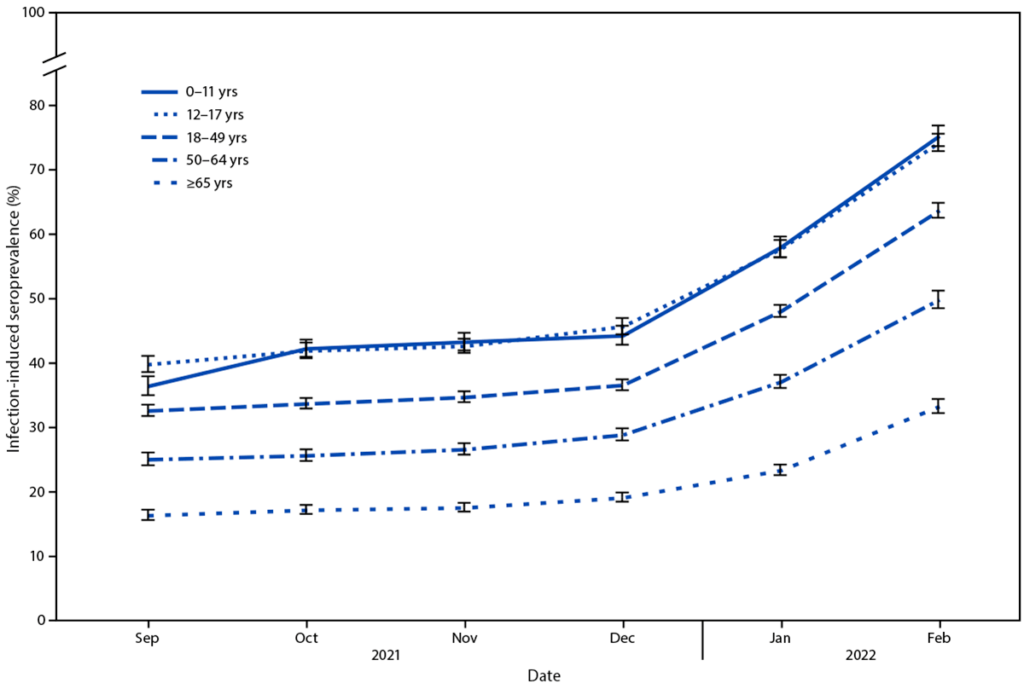
➡️ Rates vary a lot by age, ranging from 33.2% for those over age 65 to 75% for those under age 18 (see figure).
⚠️ These CDC data have some important limitations:
➡️ The data come from what is called a “convenience” sample of people getting their blood drawn for other medical reasons (not to test for SARS-CoV-2). People interacting with the health system may be different from those who do not, both in health status and social/economic factors. If these factors are correlated with the chances of being exposed to the virus, it would bias the results. The study used Census data to try to weight their data to look more like the US population by age, sex, and metropolitan areas, but this is unlikely to fix the generalizability problem. It’s hard to know exactly which way the convenience sampling would bias the results—people interacting with the medical system may be more likely to be out in the world and exposed to the virus, biasing the estimates upward. On the other hand, people with medical issues driving health care use may be more cautious and less likely to be exposed to the virus. It’s hard to guess, but the bias is there, and troubling to those of us who analyze a lot of population data.
➡️ Antibodies may wane over time, meaning that some people previously infected no longer have detectable antibodies, which could underestimate seroprevalence.
🇬🇧 The UK has been notable during the pandemic for having an AMAZING data resource that overcomes some of these challenges. The ONS Coronavirus Infection Study has been PCR testing hundreds of thousands of UK citizens every two weeks since April 2020.
The amazing part (which has made us data nerds *swoon*) is that the sample was drawn randomly and designed to be representative of the entire population. This means people are tested regularly whether or not they seek out testing or medical care of any kind. This type of population representative sampling should give much more accurate estimates of the true infection levels than convenience samples which likely have substantial but unpredictable biases.
Adding up the cumulative incidence of all of the positive PCR tests, the ONS Infection study recently estimated:
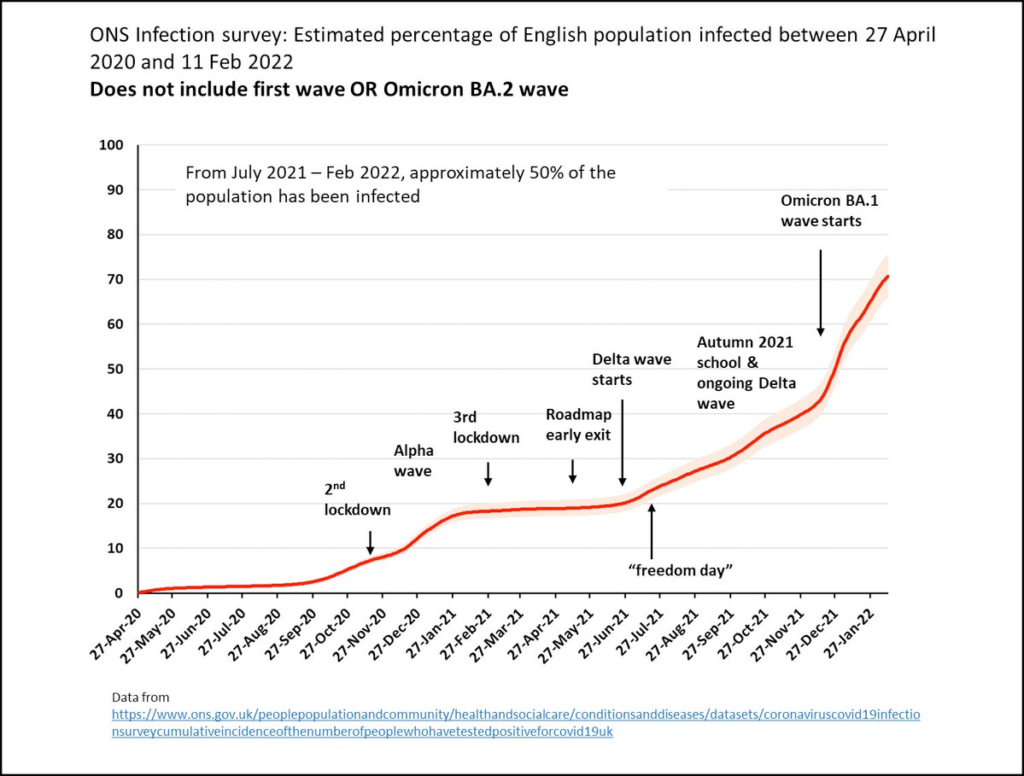
➡️ 70.7% of people in England had been infected from April 27, 2020 to February 11, 2022 (So NOT including the very first wave in March/April 2020 or last few weeks of Omicron wave).
➡️ These numbers also increased dramatically during the Omicron wave—going up from roughly 40% to 70% during that time (see figure).
➡️ ONS has not provided these cumulative estimates broken down by age, but weekly incidence data has shown a similar pattern of lower levels of infection for the oldest adults and more for children and working age adults.
⬇️ BOTTOM LINE:
We can now confidently say that the majority of the population in the US and UK has had a COVID-19 infection, with huge increases due to Omicron. As SARS-CoV-2 variants get even better at transmitting and we relax restrictions, the virus is like water that eventually finds all the cracks and crevices in the pavement.
The UK estimates are considered more reliable. The US estimates likely capture the trend (huge increases during Omicron) and a broad “ballpark” idea of the overall infection prevalence, but the precise number should be interpreted more cautiously.
Since re-infections are happening more often with Omicron, the presence of antibodies or a previous PCR test does not imply protection from future infection. Thus, we can’t really use these data to assume we are getting close to “herd immunity,” (even if we could define such thing!).
⭐ Vaccinations (including boosters!) remain the best way to minimize the harm of encountering this virus.
Links:
Figure 2: English data from ONS compiled by Dr. Christina Pagel