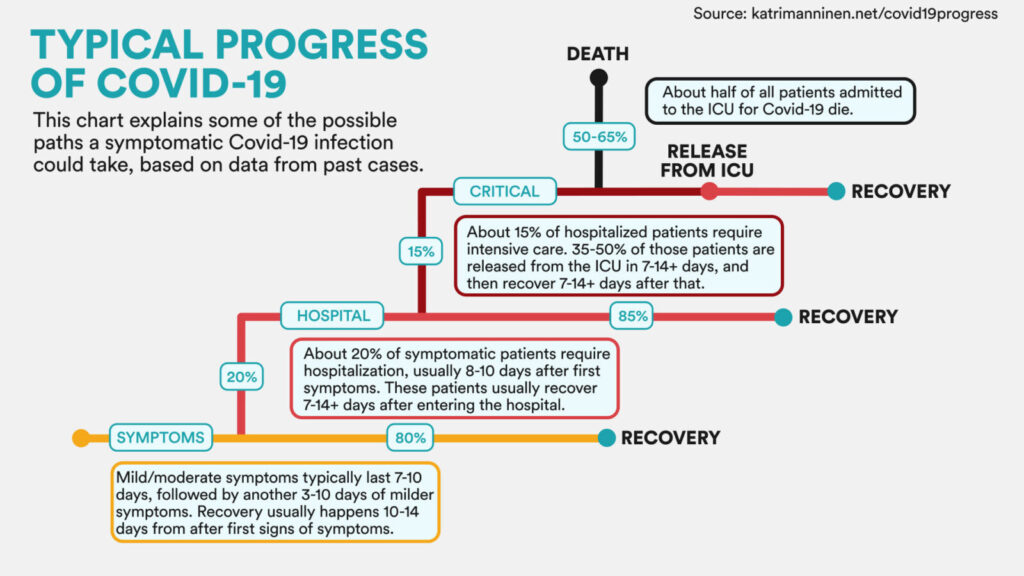
A: On *average*, about 80% of symptomatic cases will recover without hospitalization. But (big big but): your mileage may vary.
One of the things epidemiologists study is the “natural history” of a disease — or how a given disease progresses in individuals from start to finish. Most diseases and conditions have a stylized or typical progression. Individual people with the disease may follow that typical progression very closely, or may veer far off that path.
In fact, for some diseases, the proportion of cases with a typical progression is quite high (that is, most people’s disease course follows the stylized path), while for other diseases it’s hard to characterize a “typical” progression because there is so much variation.
COVID-19 has been a tricky disease to nail down from a natural history perspective. Lots of cases are completely asymptomatic, while others develop mild and then severe symptoms. Many folks can stay at home while sick and will fully recover in days or weeks, but others will have symptoms that linger for months (“long COVID”). Some severe cases require hospitalization, intensive care, and ventilation. And, tragically, some cases of COVID-19 are fatal.
Can we assign probabilities to those different paths? We can, with caveats.
A STAT News article from Friday by Helen Branswell and Elizabeth Cooney (two of our favorite COVID-19 journalists) ran a graphic showing “typical progress of COVID-19”.
In the graphic (shown below), symptomatic cases enter in the lower left, and then branch off to the right as they recover or branch up as their case worsens, from hospitalization, to critical care, to death.
Importantly, the percentages shown at each level refer to everyone reaching that level, not all cases. For example, the 15% who go to critical care (dark red path) refers to 15% of those hospitalized in the level below, not 15% of all symptomatic cases. To be clear, this chart is *not* saying that 50-65% of all symptomatic cases die, but rather that about half of cases admitted to the ICU die.
Let’s circle back to those caveats:
* This typical progression refers to averages, and doesn’t predict any individual’s disease course. Factors like age, gender, and pre-existing conditions and health status shape individual prognosis.
* This stylized graphic is based on prior cases. Our knowledge of COVID-19 and our ability to treat hospitalized patients are both increasing rapidly. This is a dynamic situation! For example, see our previous post (linked below) on whether COVID-19 is becoming less deadly.
Bottom line: Describing patterns of disease in the population is a critical function of epidemiology, and helps us track metrics like treatment success and social disparities in outcomes over time. For predictions about how you or a loved one will progress through a case of COVID-19, consult your health care team.
Stay safe and #staySMART, everyone!
Links:
Dear Pandemic on “is COVID-19 becoming less deadly?”
Graphic credit: ALEX HOGAN/STAT, based on


