Q: Wouldn’t lots of people dying of COVID19 be dying from other causes anyway?
A: Sadly, we are likely UNDER-counting deaths due to COVID-19.
Among the COVID-19 myths that just won’t die, we continue to hear chatter that COVID-19 deaths are being over-counted, such as stories of victims of motorcycle accidents getting tested in the hospital so they can be counted as COVID-19 deaths, or the infamous line that people are dying *with* COVID-19 rather than *of* COVID-19.
While some deaths attributed to COVID-19 would have occurred during this period anyway, we can calculate “EXCESS MORTALITY” – the number of deaths above and beyond those that would have been expected based on previous years.
💥 EXCESS MORTALITY—EUROPEAN EDITION 💥
💡 “Excess mortality” uses the average number of deaths in previous years as the baseline for “expected” deaths. These baseline deaths are the counterfactual—meaning what would deaths in a country have looked like in a bizarro 2020 world *without* COVID-19?
❓So the question is how many MORE deaths from ALL CAUSES have we seen in 2020 compared to the average previous years?
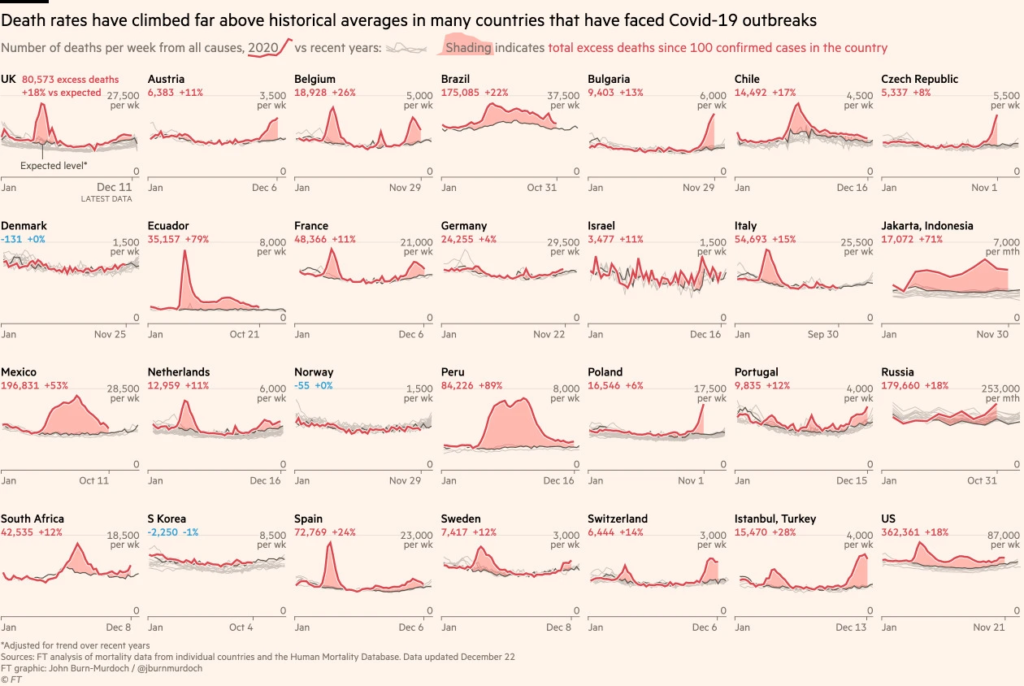
Through December 11th for England & Wales, this estimate is *80,573 deaths*, slightly MORE than the 79,351 deaths with COVID-19 deaths mentioned on the death certificate over that time.
Why would overall excess deaths be *higher* than confirmed COVID-19 deaths? The gap in England between excess deaths & official COVID-19 deaths is not very high, compared to the US where excess deaths have been 20-30% higher than official COVID-19 deaths. Some reasons why excess deaths are often higher:
➡️ “Direct” deaths. Especially early in the pandemic when testing was low, many COVID-19 cases & deaths were undetected. Deaths occurring at home and in care homes increased substantially in England and Wales during 2020 compared to previous years.
➡️ “Indirect” deaths—when hospitals are overwhelmed (as we are sadly seeing again now) patients may delay seeking care for other causes or not receive the care they need. Indirect deaths would also include increased deaths due to the social or economic impacts of the pandemic.
How do we know how many excess deaths were direct or indirect? It’s difficult to know for sure, but there are some clues in the data we have thus far.
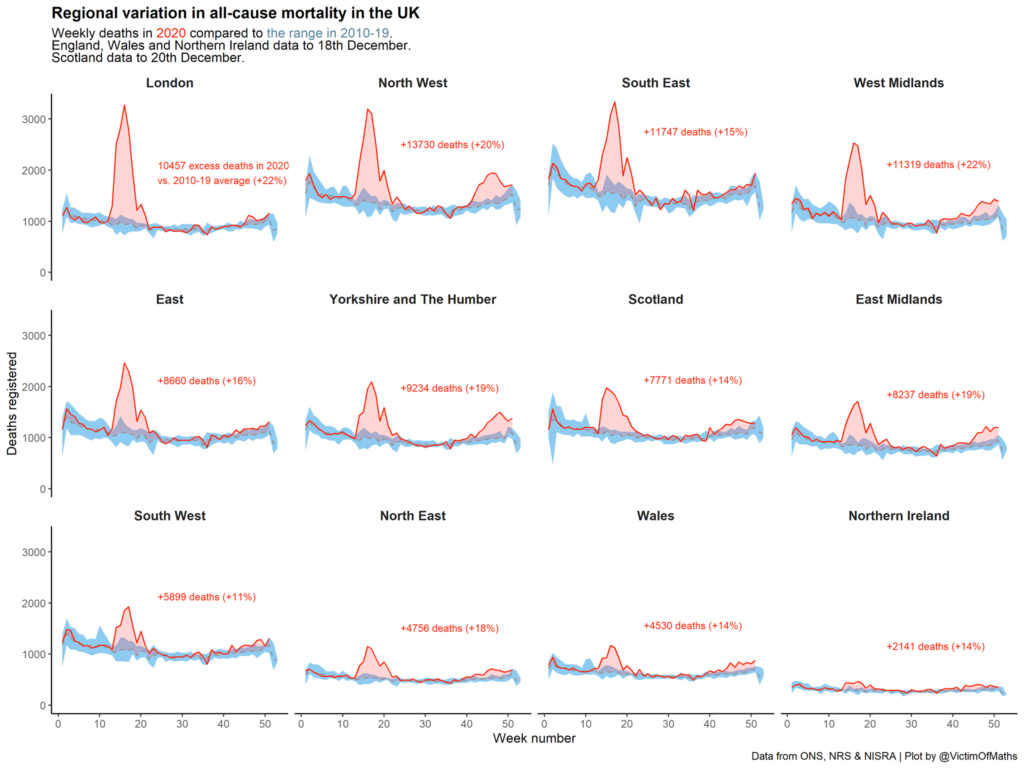
The timing of spikes in excess mortality tracks closely the path of the virus across time and space in most countries—see figure below- where London was hit worst in the first wave and the Northwest and Yorkshire show the upticks from the autumn second wave (death data is lagged so the more recent increases in London are not evident yet).
This correspondence of excess mortality with the path of the virus itself suggests many of the excess deaths are due to the virus itself, as well as delayed or reduced care from overstretched health care capacity.
Lockdown restrictions in the Spring and the economic impacts since were more diffuse across the country, so the pattern of excess mortality does not suggest these types of “indirect” deaths were high, and some evidence has shown that deaths due to car accidents, etc. declined over this period.
❓ Where has excess mortality been the worst in Europe?
❇️ Belgium (26% higher than normal, 18928 deaths)
❇️ Spain (24% higher, 72,769 deaths)
❇️ UK (18% higher, 80,573 deaths)
❇️ Italy (15% higher, 54,593 deaths)
❇️ Switzerland (14% higher, 6,444 deaths)
❇️ Sweden (12% higher, 7,417)
❓ Who has fared the best so far?
❇️ Denmark & Norway (0% excess mortality)
❇️ Greece (0.9% higher)
❇️ Finland (1.95% higher)
❇️ Germany (4% higher)
The “2nd wave” has hit Europe hard. In some countries like Spain and England the increase in excess deaths has not (yet) been as high as the extreme peak in the Spring, but other countries like Switzerland and Bulgaria who escaped Spring waves have seen high excess mortality in the autumn (see figures).
Worldwide, Latin American countries have fared amongst the worst in excess mortality:
❇️ Mexico (53% higher than normal, 196,831 deaths)
❇️ Peru (89% higher, 84,226 deaths)
❇️ Ecuador (79% higher, 35,157 deaths)
❇️ Brazil (22% higher, 175,085 deaths)
And the US?
❇️ On par with the UK, the US has seen 18% higher overall mortality compared to previous years, or *362,361* excess deaths.
BOTTOM LINE:
➡️ Excess deaths account for the fact that some people who died of COVID-19 would have died anyway, and only counts what is above and beyond what is expected.
➡️ England & Wales have seen over 80,000 MORE DEATHS than usual this year. Besides the UK, Spain, Belgium, Italy, and Switzerland have seen the worst excess mortality in Europe.
➡️ Excess deaths were seen in all countries hard hit by the pandemic, but not in countries that have not (Norway, Denmark, Finland, Greece).
➡️ This is not a coincidence and corresponds closely across time and space with the spread of COVID-19.
➡️ When the Nerdy Girls get worked up about COVID-19 prevention, THIS is why. COVID-19 is not a hoax, not just a normal cold or flu. Counting ALL the bodies sadly does not lie.
➡️ Hope is on the horizon. Each COVID death we can prevent now need never happen once that person is vaccinated.
➡️ For the winter, hunker down and Stay Safe, Stay Sane. Each day will be a bit brighter…
Love,
The Nerdy Girls
Further Reading:
Recent DP excess mortality summary in the US
Our World in Data Excess Mortality explorer
Financial Times coverage of excess mortality